When work moves at the speed of business.
Clear thinking for leaders who need decisions to move faster and land with confidence.

Subscribe to our newsletter
News, articles, and resources every month.
Latest Posts
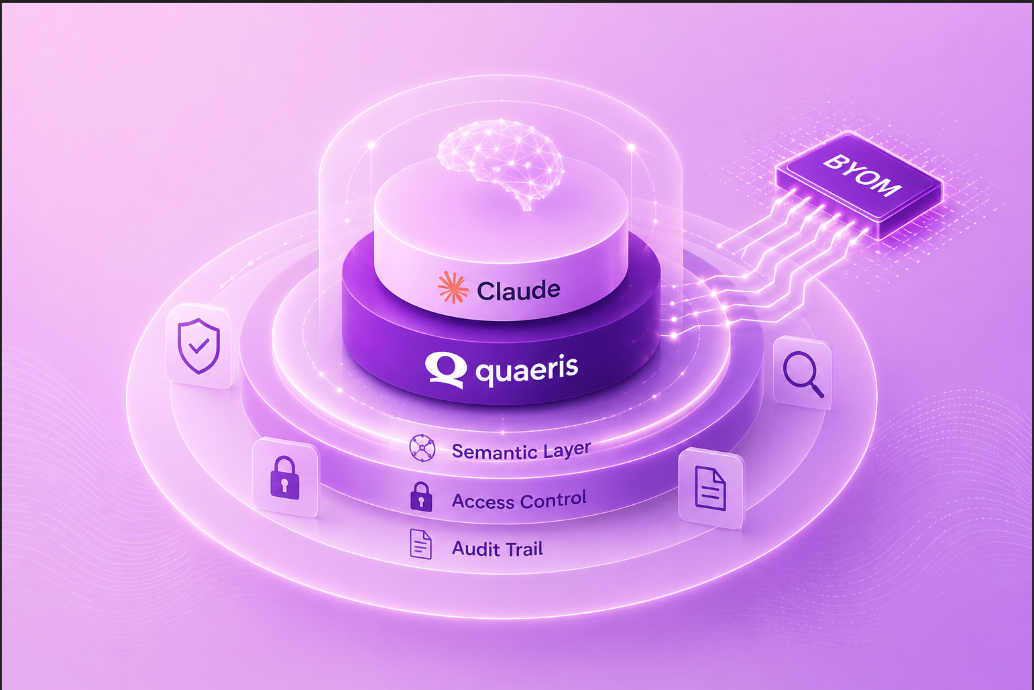
Quaeris AI vs Claude, How It Is Different?
Quaeris AI vs Claude: understand the model layer vs. governed analytics platform, enterprise data guardrails, BYOM support, and which fits your use case.
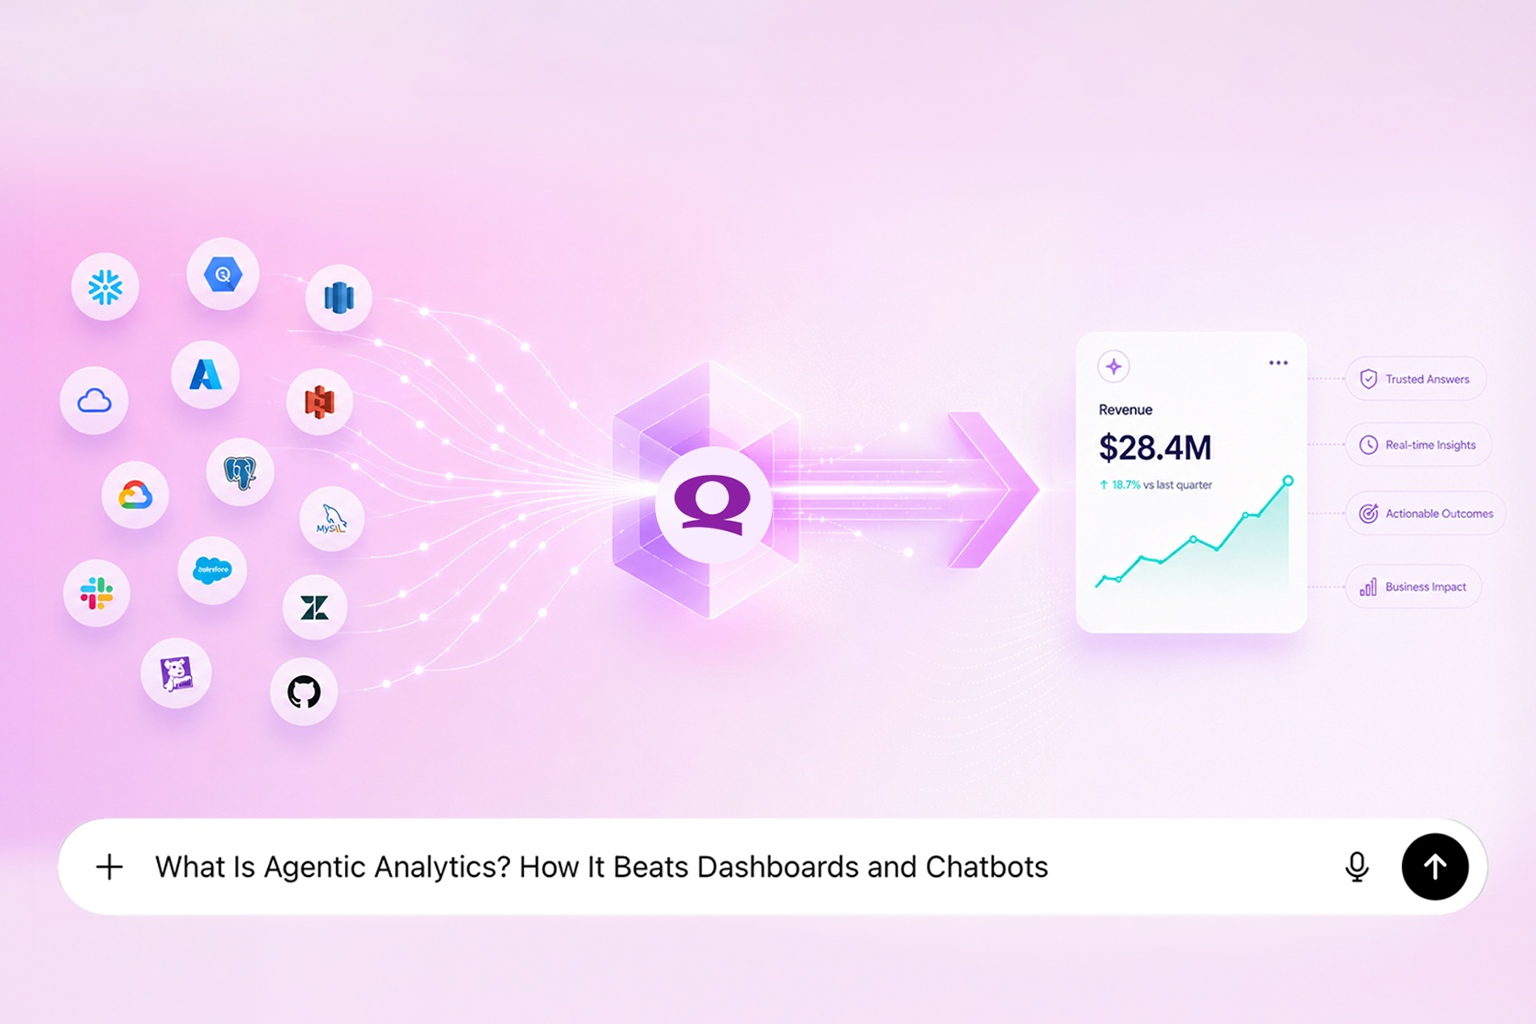
What Is Agentic Analytics? How It Beats Dashboards and Chatbots
Agentic analytics uses autonomous AI agents to continuously monitor data, diagnose issues, recommend fixes, and even take action—unlike BI dashboards (passive) or chatbots (one-off answers).

The Audit Industry Is Facing a Breaking Point. Agentic AI is the Fix.
QuaerisAI reclaims 80–100 hours per audit engagement. Less manual work, better coverage, stronger margins.

Why teams don't trust the data — and what to do about it
Trust is the missing ingredient in most analytics stacks. Here's how to rebuild it across teams.
Why Insight Still Doesn't Lead to Action
The gap between knowing and doing is where value leaks. Close it with context that travels.
Why Alignment Accelerates Speed More Than Authority
Aligned teams move faster through shared understanding, trusted data, and clear context.
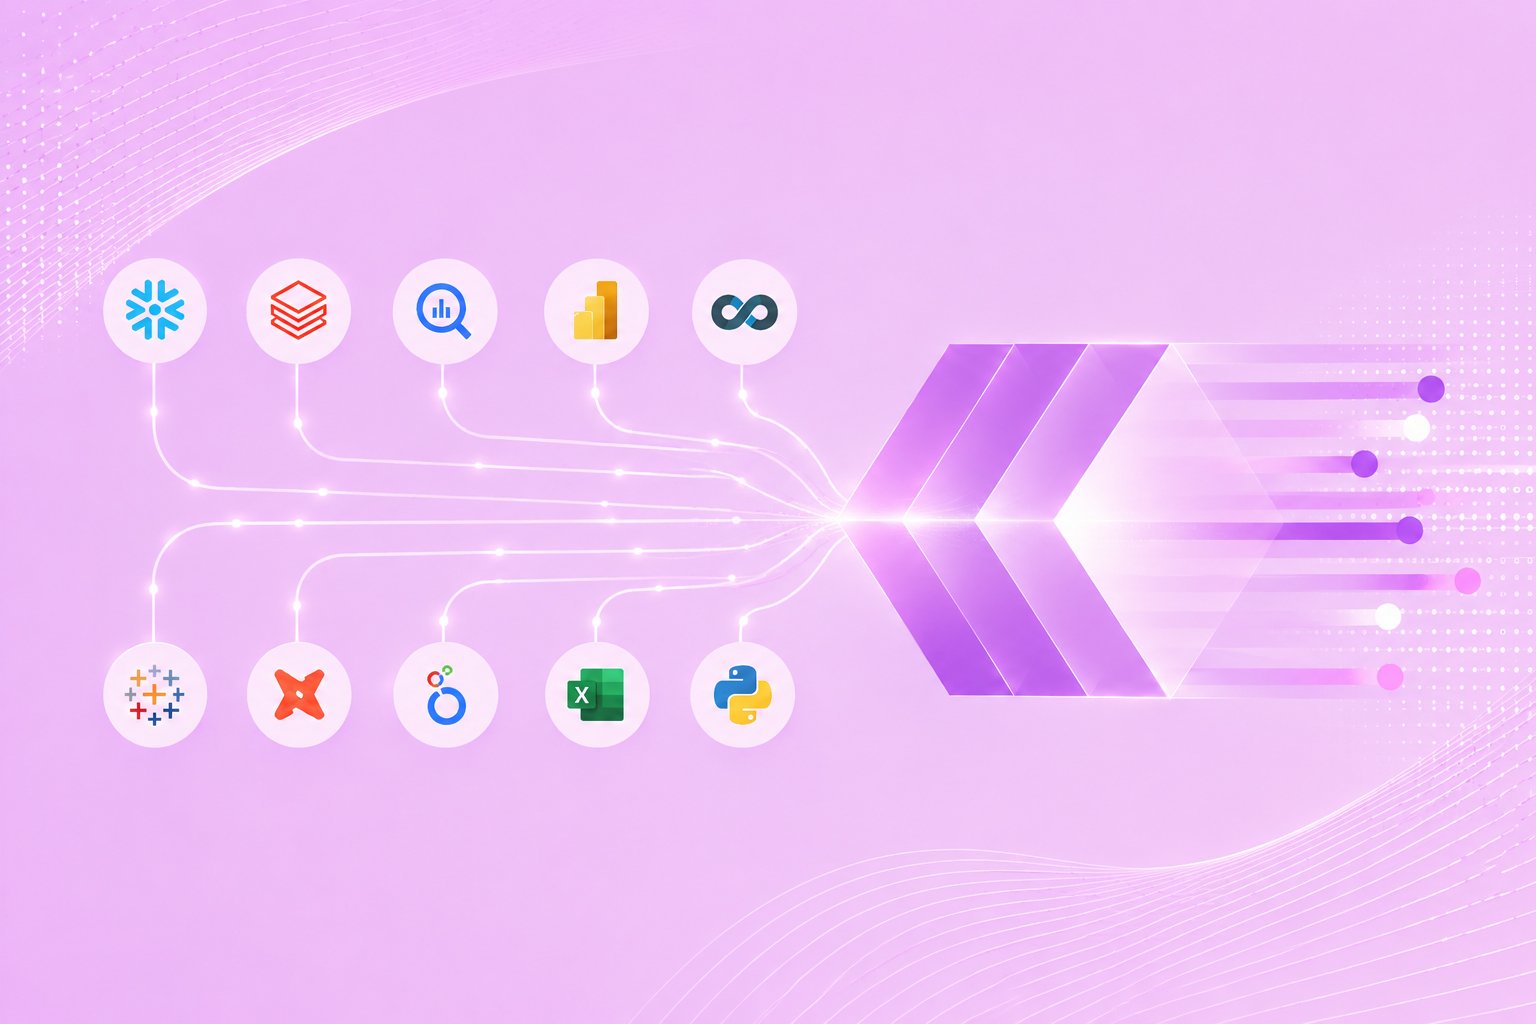
Your Analytics Team Is Not Slow. Your System Is Fragmented.
Fragmentation — not effort — is the real bottleneck behind slow analytics delivery.
Why Data Value Is Realized at the Moment of Decision
Trusted analytics drives faster business actions, reduced opportunity cost, and confident decisions.
How Decision Velocity Becomes a Competitive Advantage
Decision velocity is the new edge. See how rising flow signals translate into market wins.
The Hidden Cost of Translating Business Questions into Queries
Every translation step from question to query introduces drag. Remove it with conversational data access.
Stop Moving Data, Start Moving Decisions
Bring AI to live data — accelerate decisions, reduce pipelines, and improve governance without moving data.
Identifying Hidden Profit Leakage in Retail Deductions
Find and recover the margin lost in deduction noise — with answers tied to source.
Ready to see it in action?
Book a 30-minute demo and get answers from your own data — live.
Clarity that moves work forward.